


Energy bills are higher for many residents these days. Photo provided by NYSERDA.
It’s Not Just You: 3 Reasons why Everyone’s Energy Bills are Higher
And some things you can do about it
By Karim Beers
Article summary: There are three main reasons why your utility bills may have been significantly higher this past winter. First, it’s been a cold winter, and most people have been using more energy to stay warm. Second, the market driven supply costs for natural gas have increased significantly over the last few years, and especially this winter. Since most of the electricity in New York State comes from natural gas power plants, the costs of electricity closely follow those of natural gas. Demand for natural gas has increased in recent years, as the country now exports more gas to higher prices markets, and was further increased by the unusually cold winter. And third, utilities have recently raised their delivery rates, in part to cover costs of replacing aging infrastructure and protecting the infrastructure from more frequent and intense storms.
These, and a few other reasons are explored in the full article below, along with steps you can take to reduce energy usage and cut your energy bills.
Community Energy Advisor Leigh Miller recently gave a webinar on this subject as well, which is available on our Youtube page.
Article:
Community Energy Educators at Cornell Cooperative Extension’s Smart Energy Choices program have been hearing from residents from around the region who are concerned about higher utility bills for both electricity and natural gas. In this article, we will explain three significant reasons behind these increases and describe some things to do to reduce future bills.
To start, it is good to remember there are two broad factors behind increased energy bills--higher energy rates, and higher energy use. (There can also be malfunctioning meter equipment, which we will touch on at the end, but this is rare, though not unheard of.) Everybody is experiencing rising utility rates, and some also have increased energy use, which multiplies the costs even further.
Let’s start with energy use. Are you using more electricity (measured in kWh) and natural gas (measured in therms) than you were last year? How can you check? With our regional utility, NYSEG, you can find this information in several places:
Your bill, following the charges for electricity and gas, contains a chart with energy use by month for the last year (see page 4 of NYSEG's sample bill and image below). Here you can check your current month’s usage against last year’s;
Your online NYSEG account provides billing information for the last two years at https://portal.nyseg.com/billing;
You can visualize your energy use and compare periods using NYSEG’s Energy Manager program at https://energymanager.nyseg.com/insights.
Both latter methods require an online account, which is free to set up.
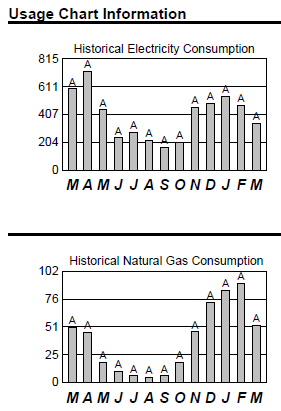
Example of energy use chart found on NYSEG energy bills. In this case, electricity use in March decreased from the prior year, while natural gas usage was about the same.
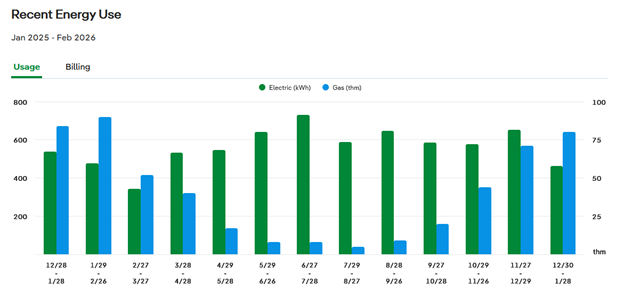
Visualization of energy usage for electricity (green) and natural gas (blue) over the course of a year in NYSEG’s Energy Manager program. Natural gas peaks in the cold winter months, and is minimal in the summer, when it is mostly used for water heating. Electricity use typically is higher in the summer if you use AC.
If your energy use is up compared to the previous year, you can try to sleuth why that might be. This brings us to the first driver behind increasing utility bills.
1. It’s been a cold winter.
This past January was the second coldest January in the state in the last decade, according to NYSERDA records. So, your bills associated with heating have likely increased since you will have used more energy to keep your home warm. This is true regardless of your heating source, as you will have used more energy--electricity, natural gas, propane, wood, wood pellets, or kerosene--to stay warm and comfortable.
You may have seen increased energy usage for other reasons as well. Did you purchase a new dehumidifier? Did you switch your heating system from a wood stove to an electric furnace, or use a lot of plug-in heaters? If so, your electricity usage will be significantly higher.
*
The other factor behind increased bills is higher energy rates. There are a number of factors behind recent rate increases. But before we enter into this explanation, it is good to understand that your utility bill has two major cost components: supply and delivery.
Supply costs are not set by the utility but are based on market prices for electricity and natural gas. Utilities purchase these energy commodities from the lowest cost supplier at an energy auction. Such costs therefore rise and fall with the trends of the market. Customers can choose to purchase their supply from companies separate from the utility, known as ESCOs (Energy Services Companies, more on these later), but these suppliers are also at the mercy of market pressures.
In contrast, delivery refers to the costs associated with the utility transporting the energy from the supplier to your home. It includes the distribution infrastructure: the power lines and associated equipment. Delivery costs are determined by the utility (through a highly regulated process described later).
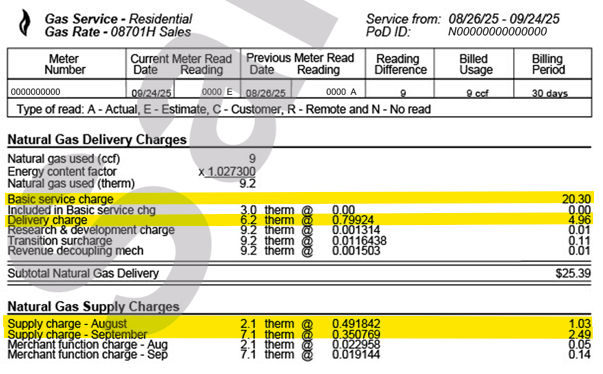
A screenshot from NYSEG’s website of a sample bill provided below contains electric and gas service, each of which is divided into delivery and supply charges. Together with the “Basic service charge”--a flat fee that utilities charge to all customers regardless of usage to cover their costs outside of delivery--the delivery and supply charges make up close to 90% of the bill. The remainder is taxes and fees.
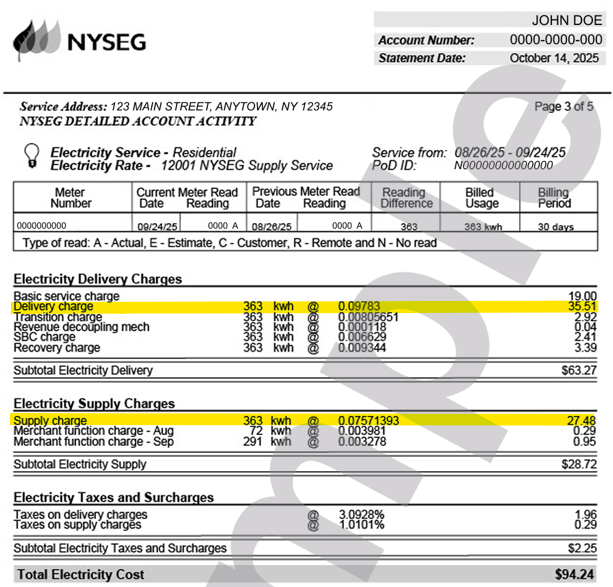
Note in the gas portion of the bill the Basic service charge is more significant, as the bill is from September, when not a lot of gas tends to be used.
NYSEG’s webpage linked above explains each charge in more detail.
Both delivery and supply costs have increased recently. We will first explore supply costs, the second of three major reasons behind utility bill increases.
2. Supply costs have gone up
The following chart from NYSEG’s website illustrates the increase in the cost of natural gas for an average customer using 1,000 therms of gas a year over the last decade. In the chart, the green represents Delivery charges, blue is Supply, and yellow represents taxes and fees. Supply costs--in the chart labeled as “Commodity”, representing the cost of natural gas on the commodity market--go up and down. The cost has increased by over 50% from $27 to $41 a month over the last decade (more than inflation). (Delivery costs have also increased, which we cover in the next section.)
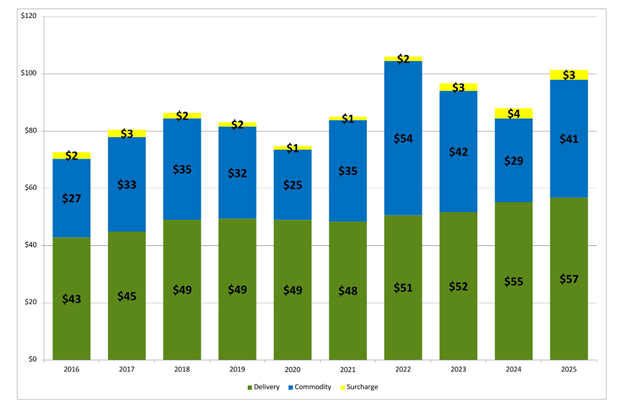
Monthly Residential Natural Gas Cost for an Average NYSEG Customer (1,000 therms a year)
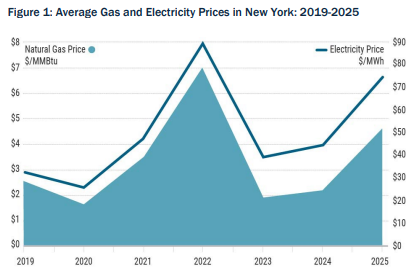
What drives the cost of natural gas? Global market forces. The US produces a lot of natural gas, including from the Marcellus Shale in Pennsylvania. Much is used domestically, but increasing amounts are exported overseas, where producers can currently get much higher prices. According to this January 2026 report from NYISO which explains the impact of national and international conditions on electricity prices, natural gas prices peaked in 2022 following the Ukraine-Russia war, which disrupted gas supplies into Europe from that part of the world. And since the price for electricity produced in New York State is mostly set by natural gas fired power plants, the price of electricity travels up and down with the price of natural gas. The following chart from the same NYISO report illustrates this connection well. The prices here are wholesale, not retail prices paid by residential customers.
The previous charts contain data through 2025. But electric and gas prices in January 2026 went even higher. A February 2026 report from the Energy Information Administration, a U.S. government agency, reported that wholesale natural gas prices increased by 81% from December 2025 to January 2026 due in great part to increased demand from the cold winter.[1]
The NYISO report lists a few additional reasons for the increase in electricity supply costs. They explain that new energy projects have come online more slowly than some fossil fuel generators have retired. This has meant that the grid has relied on older and more costly generators at times, resulting in higher electricity prices.
3.Utilities have recently raised their delivery charge rates
From October 2023 through May 2025, NYSEG increased their delivery charge rates for electricity by 62%, and for natural gas by over 17%. The basic service charge for each also increased by a few dollars each month. In the previous section, we saw how natural gas supply prices increased by over 50% over the last decade. The following chart illustrates the increase in the cost of electricity for an average customer using 600 kWh a month over the last decade. As before, the green represents Delivery charges, blue is Supply, and yellow represents taxes and fees. All have increased, leading to an average monthly electricity bill for an average user going from around $70 to over $140. This, of course, is an average. If you heat with electricity, for example, with heat pumps or electric baseboard, your kWh usage will be in the thousands, and costs will be many times the average.
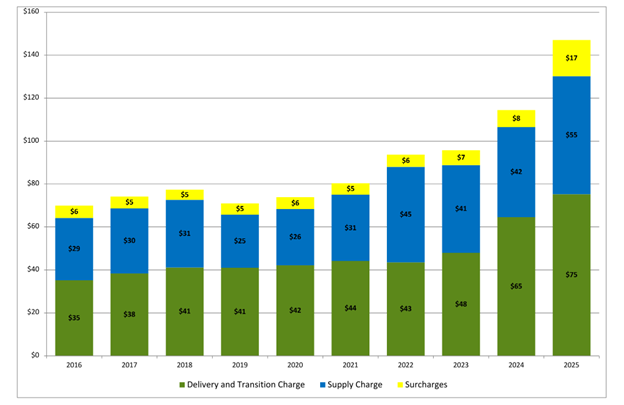
Residential Electricity Cost for an Average NYSEG Customer (600 kWh a month)
Over the course of a decade electricity delivery charges (green) have more than doubled, increasing from $35 to $75 for what is considered average usage. The bulk of that increase occurred between 2023 and 2025, when NYSEG’s latest delivery increase took place.
As noted earlier, utilities are heavily regulated by states. When large investor-owned utilities like NYSEG propose rate increases, they use a process called a “rate case”, which is overseen by the state’s Public Service Commission, in which the utility argues its case for increasing rates, and other groups and individuals provide testimony suggesting other options. In the end, the Public Service Commission makes a decision on whether the rate increase is justified and by how much. While the process is carried out in an open and public manner, the documentation is very technical, and documents are often hundreds of pages long, making it challenging for most people to follow along or participate in the process. This page from the Department of Public Service explains the rate case process in more detail.
One major reason given for the previous rate increase included upgrading old grid infrastructure--pipes and pump stations for natural gas, and poles, transformers, substations for electric. New York State is one of the first states in the nation to develop utility infrastructure, and much of that early infrastructure needs to be replaced. Another reason: increasing tree-trimming to protect transmission lines from falling trees, especially in light of increasing storm intensity from climate change.
NYSEG submitted a new rate case in 2025, requesting a 35% increase to electric delivery rates and 39.4% increase to gas delivery rates. According to this memo from the Department of Public Service, NYSEG estimates this will increase an average electric bill (600 kWh a month) by $33.12 and an average gas bill (83 therms a month) by $33.57. Again, this is for the average user. Those with higher usage will see a larger dollar increase if the rate case is approved at the requested level.
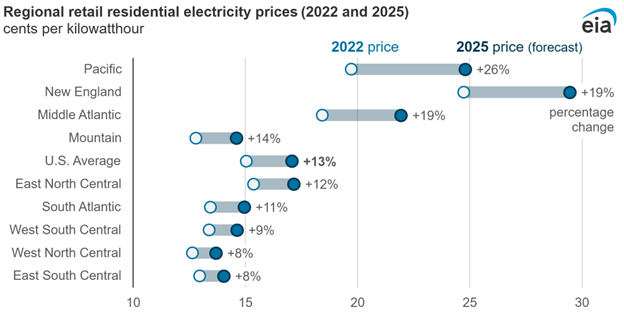
While electricity rates have been increasing across the country over the last several years, New York State is one of the regions where prices have increased the most. The graph below from a May 2025 U.S. Energy Information Administration report shows price forecast increases in all the utility regions in the continental U.S., with New England--which New York is part of--showing one of the highest increases from approximately 25 cents a kWh to close to 29 cents. Note that this is a statewide average, and upstate electricity prices are generally much lower than downstate. (NYSEG’s residential cost was on average 22 cents a kWh in 2025, and between 24 and 25 cents a kWh in January and February of this year.)
Multiplier Effect
Just from these three reasons--increased usage, increased supply rates and increased delivery rates--you can see how costs can not only add up, but multiply. Let’s look at the electricity price increases from 2023 to 2025, when the total price of electricity increased by a little over 50%. Let us say that due to the cold winter or other factors your household uses 50% more energy. Your energy bill would not increase by 50%, but would more than double, because you multiply the cost increase by the increased use. Just as an illustration, say you used to pay 10 cents a kWh, and it increased by 50%, so you now pay 15 cents a kWh (we’re using easy multiples for our calculations; actual February 2026 NYSEG rates were around 24 cents). And just to use round figures say you used to use 1,000 kWh, and it has increased to 1,500 kWh with the cold weather. Previously, your typical bill was 10 cents/kWh x 1,000 kWh = $100/month. But now it is 15 cents x 1,500 kWh = $225. So even though each component of the bill increased by 50%, your total bill more than doubled.
As you may have noticed in the above charts, the cost of electricity has gone up more than the cost of natural gas. Thus, those who use more electricity will be feeling the effects of increases more acutely. If you use electricity for heating--with heat pumps or electric baseboard heaters, for example--your usage will be much higher than 600 kWh a month, and your bills will also be significantly higher. Even a single plug-in 1,500 watt electric resistance heater will use over 1,000 kWh a month and cost you over $200 if left on all the time. At this point in time, heating with natural gas tends to be cheaper than electricity or heat pumps. However, heat pumps cost less to operate than fuel oil, propane, or electric resistance heat (baseboard, etc.).
Other Reasons: ESCOs, Day/Night Rates, Billing Issues & Smart Meters
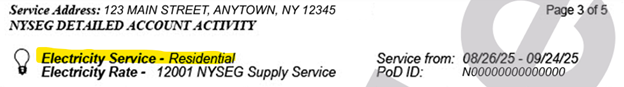
While the three reasons cited above are the primary drivers behind utility bill increases, there may be other reasons your bills are higher than usual. You may purchase your supply through an ESCO (Energy Service Company) and end up paying more for electricity or gas. The New York State Public Service Commission, which regulates utilities, has been critical of ESCOs, many that offer a low introductory supply rate, and then increase it significantly after a certain period. This can leave the customer paying much more than they would have had they stayed with the default utility. ESCOs can, on the other hand, offer a 100% renewable electricity option (at a higher cost than NYSEG’s default supply), and they can offer fixed rates over the course of the year, which consumers can use to hedge against future price increases. You can learn more about ESCOs and compare their pricing on this New York State site. You can find whether you are signed up for an ESCO on page 3 of your NYSEG bill under “Electricity Rate” (see image below).

While most residential customers are enrolled in the standard service option and are billed at a constant rate for the electricity they use during the course of the day, some may be signed up for a Day/Night rate, where there are different rates for electricity used during the day vs used at night, or another Time of Use rate that has different prices for peak, mid-peak and off-peak usage. While it may be possible to enjoy lower rates with these service types under some conditions, in recent months, day/night rates have been higher than the standard electricity rate. The type of Electricity service you have appears at the top left of your electricity bill (see image below). You can learn more about these three NYSEG service options on this page.
Also, in some cases, due to billing issues, you may not have been billed for the previous month or two and then receive a big bill for the past several months. Or, if you are on Budget billing, which spreads your utility costs evenly throughout the year, you may get a year-end that is larger if you use more energy than was anticipated, as it includes the overage from the previous months.
In addition, while not common, digital smart meters can malfunction. If your energy usage is much higher than what it was before the smart meter was installed and you believe it may be providing inaccurate readings, you can call NYSEG to have it checked.
What you can do
While it is difficult for an individual to influence long-term market forces and utility rates, there are some things you can do to address the challenge of high utility bills. Again, we will look at both reducing energy use, and other ways to reduce the costs of energy bills.
To reduce energy use, a great place to start is getting an energy assessment. These are free, as they are paid for by a small line on your bill called the System Benefits Charge (SBC), which covers energy efficiency and renewable energy programs and rebates. A participating contractor can assess your home and determine ways to reduce gaps and cracks where heat can leak out, or where you can increase your home’s insulation, which acts like a thick sweater to keep heat in during the cold months. Cornell Cooperative Extension’s Smart Energy Choices program has information on such energy assessment programs and incentives, programs that serve renters and homeowners. We also have a page on Heating tips.
Low-income residents, renters or homeowners, may qualify for energy bill assistance programs. NYSEG’s Energy Assistance Program for low income and moderate income residents provides a monthly discount directly on your bill; and the federally-funded Home Energy Assistance Program (HEAP) can help pay for heating bills. Other resources for dealing with high bills and utility bill shut offs can be found on this page.
To reduce electric costs, you can also turn to the sun. Almost anyone with a utility bill can sign up for subscription solar, where you get a credit on your electric bill from a solar farm, saving 5-20% on your electric bill each month. Homeowners may consider installing solar on your roof or property. A properly sized system will cover 100% of your electricity needs over the course of the year.
For questions about any of the above programs, you can reach out to a Community Energy Adviser. Our Cornell Cooperative Extension Smart Energy Choices educators serve residents and small businesses and organizations throughout the eight beautiful counties of the Southern Tier.
Finally, there are also ways to get involved in the conversation around energy, and to contribute to shaping policy. You can contact your local representatives, many of which are interested in these topics. You can find your representatives here. You can make comments in the recent NYSEG rate cases (learn more here). You can also sign up for our monthly newsletter, where we will keep you informed about opportunities for public comment and engagement in energy issues.

Smart Energy Choices staff
The next 25 Years: An Energy Transition
In the context of a rapidly-warming world due to greenhouse gas emissions primarily from burning fossil fuels, New York State has set goals to transition to 100% clean electricity in the coming decades, and to reduce fossil fuel use significantly. Replacing fossil fuel generators with renewable energy and batteries, electrifying homes, buildings and transportation, will have major impacts on our energy systems.
There has been some concern that programs to achieve these goals will increase energy prices for consumers. A September 2025 report [pdf] from the Department of Public Service gauged the impact of these programs on utility bills. The report estimated that in 2024, 7.5% of a typical residential electricity bill and 1.8% of a typical gas bill for NYSEG customers are associated with the State’s clean energy goals. This represents a little over $10 for an average bill. It is good to remember that these same costs help pay for programs that help residents reduce energy bills by lowering energy use through insulation and air sealing.
There is also evidence that renewable energy and battery storage can help lower wholesale electricity prices and are faster to build, deploy and manage than fossil fuel systems, thus reducing future energy costs to consumers (see for example here and here). And there is plenty of evidence showing that the costs to society of continued fossil fuel use in the form of health, natural disasters, and the environment will be much greater than investing in renewable energy sources and energy efficiency (see for example the New York State Climate Action Council Scoping Plan and the International Panel on Climate Change’s 2023 Synthesis Report).
While it may be difficult to project energy prices for the future, we can take steps to reduce our energy use in our own home and help our communities do the same and move towards cleaner forms of energy.
References & Further Reading
The 2025 New York State Energy Plan contains a deep dive into the state’s energy issues, and includes analysis of impacts of the plan’s goals on affordability [pdf].
NYSEG Rate Hikes on Gas & Electricity — Smart Energy Choices - article by Jes Wickham, January 2024
Monthly Cooling and Heating Degree Day Data - NYSERDA - webpage accessed 3/2/26
Major Rate Case Process Overview | Department of Public Service - webpage accessed 3/2/26
Factors Influencing Recent Trends in Retail Electricity Prices in the United States | LBL ETA Publications - Report by Lawrence Berkeley National Laboratory - 2025
Electricity Prices in New York - NYISO, February 2026
U.S. Energy Information Administration, Short-Term Energy Outlook, February 2026
U.S. electricity prices continue steady increase - U.S. Energy Information Administration (EIA) - May 14, 2025
[1] U.S. Energy Information Administration, Short-Term Energy Outlook, February 2026